
Grepr Blog
Read the latest news and articles on the industry, our product, and company.
Product Features
Grepr Just Launched a Free Tier: Reduce telemetry noise by 90%
Grepr's free tier is live: perpetual, no credit card, 4 TB of logs and 8 TB of traces a month to run on your own data.

Announcements
Grepr Wins the 2026 Intellyx Digital Innovator Award for Observability Cost Reduction
Observability bills climb while teams delete the data they need most, and the recognition Grepr just earned points straight at why that tradeoff no longer has to happen.

Events
What We Heard at Observability Summit 2026
Every AI conversation at the summit dragged a cost conversation behind it, and most teams already knew which one was winning.
.png)
Comparisons
Sawmills vs Grepr: Telemetry Pipeline Comparison for SREs
Both pipelines claim to cut observability costs with AI, but the rule management, trace handling, and S3 storage models work in completely different ways.

Events
Grepr at Observability Summit 2026
Datadog bills are climbing again, and the teams paying them will be in Minneapolis this month. Grepr will be there too.
.gif)
Engineering Guides
How to Reduce Telemetry Data Costs Without Losing Coverage
Filter rules force you to guess which data matters before you need it. Pattern-based sampling with full retention doesn't.
Signals
How to Retain Raw Telemetry Data for HIPAA Compliance Without Breaking Your Budget
HIPAA requires six years of telemetry retention, and a two-tier architecture that sends reduced data to your observability platform and raw events to S3 with Parquet and Iceberg satisfies the mandate without the six-figure storage bill.
.png)
Engineering Guides
Grepr for Kubernetes Environments: Architecture and Implementation
Kubernetes environments drown observability platforms in redundant log data, and Grepr uses semantic machine learning to reduce that volume by up to 90 percent while preserving every raw event in low-cost S3 storage.

Engineering Guides
Structured Logging Best Practices for Modern Apps in 2026
Unstructured logs make parsing, searching, and alerting harder while driving up storage costs, so this guide covers the structured logging practices that matter most for production systems in 2026.

Engineering Guides
How to Store Logs in S3 Using Parquet and Apache Iceberg for Cost Savings
The ingestion bill is visible. The storage bill is the one that compounds.

Events
KubeCon Amsterdam 2026: Hallway Conversations Said What Keynotes Didn't
KubeCon EU 2026 made one thing clear: AI infrastructure is generating telemetry volumes that most observability budgets were never built to handle.

Engineering Guides
How to Drop Noisy Health Check Logs Before They Hit Your Observability Platform
Healthcheck logs generate millions of identical lines per day and silently inflate your observability bill, but filtering them at the right layer can cut total log volume by 15 to 40 percent.
.png)
Comparisons
New Relic Pipeline Control vs Grepr: Manual Rules vs AI Automation
New Relic Pipeline Control bills you on data volume before any filtering happens, requires manual YAML config for every pipeline, and needs a separate Kubernetes install per environment.

Signals
The Observability Data Hoarder's Guide to Letting Go
Your Datadog bill keeps climbing because teams store more data to solve a retrieval problem, and that has never actually worked.
.gif)
Signals
APM Traces vs. Application Logs: What's the Difference and Why It Matters
Application logs capture developer-written context about business logic and internal state; APM traces automatically record request flow and performance across services, and understanding the difference explains why both inflate your observability bill.

Signals
HIPAA Requirements for Observability Data Retention: What Engineering Teams Need to Know in 2026
Most engineering teams running healthcare or FinTech systems are sitting on a HIPAA retention gap they have not found yet, and their observability vendor is not going to flag it for them.
.png)
Announcements
Announcing the first proactive AI SRE agent
Grepr's proactive AI SRE agent monitors system behavior in real time, catching anomalies before they become outages, without waiting for a threshold to be crossed or a rule to be written.

Signals
What Is App Logging and Why It's Making Your Observability Bill Explode
A breakdown of why app logging bills grow faster than your user base, and how to cut volume without losing observability coverage.
Comparisons
Grepr vs. Observo: Choosing the Right AI-Powered Observability Data Pipeline
Observo and Grepr both use AI-driven pipelines to reduce observability data volumes, but where Observo requires complex manual configuration, Grepr automates 90% or more of data reduction from day one.
Comparisons
Grepr vs. Mezmo: Comparing Observability Pipeline Solutions
Grepr and Mezmo both promise observability cost control, but where Mezmo layers on complexity, Grepr cuts data volume by 90% or more with zero disruption to existing workflows.
Events
Livestream Recap: How Jitsu Cut Observability Costs Without Flying Blind
Jitsu's CTO joined us to explain why the real cost of observability isn't your monitoring bill, it's how long it takes your engineers to find the problem when something breaks.

Announcements
The Observability Debt: Why More Data is Making Us Less Reliable
Observability was never reliability - it was a proxy that's finally broken under the weight of non-linear complexity, runaway telemetry costs, and a fundamental inability to move from seeing problems to stopping them.

Engineering Guides
Regain Control of Your Datadog Spend
Modern microservices applications generate petabytes of observability data monthly, and most of it is noise Datadog still charges you to store.

Signals
The Observability Reckoning Is Here. It's Why I'm at Grepr.
Observability was supposed to help teams control complexity in the cloud era. For many organizations, it has become one of the fastest-growing line items in the budget.

Signals
Why Automated Context Is the Real Future of Observability
The observability industry keeps building smarter tools on top of the same noisy data, and a recent post from a Sr. Engineering Manager at Walmart shows exactly why that approach hits a wall.

Signals
The Ferrari Problem in AI Infrastructure (and Why It Applies to Your Observability Bill Too)
The same discipline required to right-size AI compute infrastructure applies directly to observability, where defaulting to ingest everything drives massive costs for data that never gets queried.

Engineering Guides
How to Reduce New Relic Costs With Grepr: A Step-by-Step Setup Guide
Grepr reduces New Relic costs by applying ML-based log reduction upstream of ingest, summarizing high-volume patterns while preserving unique events, anomalies, and any logs referenced by your existing dashboards and alerts.

Engineering Guides
Privacy and Data Ownership in Observability Pipelines
Grepr lets you keep your raw log data in your own S3 bucket while still getting the benefits of a managed observability platform.
.png)
Comparisons
How Grepr and Edge Delta Take Different Paths to the Same Goal
Both Edge Delta and Grepr use AI to process observability data streams, but Grepr's automatic pipeline management delivers faster time-to-value with minimal configuration while Edge Delta requires ongoing manual maintenance.

Engineering Guides
You're Paying for Data You'll Never Use
The logging paradox forces organizations to index everything at massive cost because they cannot predict which fraction of data a future incident will require.

Engineering Guides
5 Signs Your Observability Pipeline is Costing You Too Much
Most observability overspending comes from paying premium prices to store logs nobody queries.

Engineering Guides
The Hidden Cost Crisis in Observability: What Your Team Needs to Know in 2026
Observability spending hit $28.5 billion in 2025, and 96% of organizations are now actively working to bring costs under control.

Engineering Guides
Why First Mile Log Processing Reduces Costs Before Ingestion
First mile log processing with Grepr filters and routes logs before they reach expensive observability platforms, reducing costs by 90% while preserving 100% visibility by sending high-signal data to premium platforms and routing routine logs to low-cost storage.
Engineering Guides
Remove Sensitive Data From Your Logs With the SQL Transform
Grepr's SQL transform enables real-time redaction of sensitive data like passwords from log events before they reach your data lake or monitoring platform, using familiar SQL syntax within your log processing pipeline.
.gif)
Events
Three Weeks, Three Conferences, One Clear Message About Observability Costs
Across KubeCon, AWS re:Invent, and Gartner's IT Infrastructure conference, one message was consistent: observability costs are rising faster than value, and teams need high-signal data that supports AI scale, infrastructure decisions, and budget accountability.
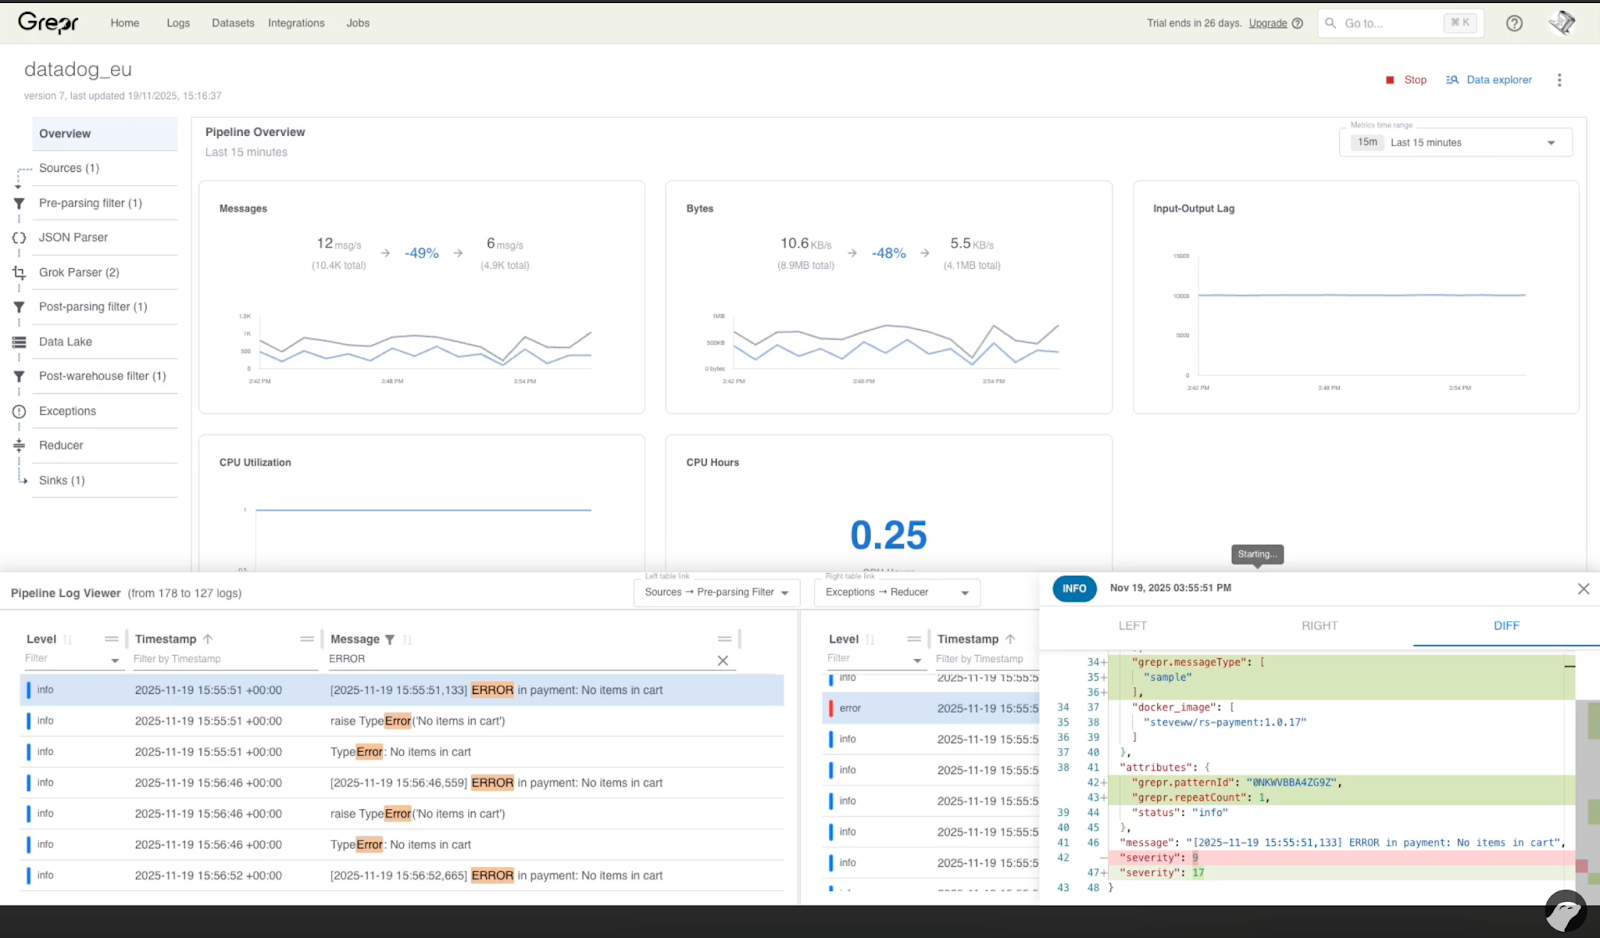
Product Features
Grepr Live View: Test Pipeline Changes with Production Data
Live View clones your production pipeline so you can test configuration changes against real data streams without any deployment risk.
.png)
Announcements
Grepr Recognized by Gartner as a Cool Vendor for AI Driven Operations
Grepr was recognized by Gartner as a Cool Vendor in AI for IT Operations for its ability to give AI driven systems cleaner signal, lower cost, and real-time pattern detection that powers advanced LLM workflows.
Product Features
Using Grepr With Grafana Cloud
Grepr cuts Grafana Cloud log costs by up to ninety percent through a simple configuration change that redirects your existing shippers to use semantic machine learning for automatic pattern aggregation while preserving all raw data in low cost storage.
Product Features
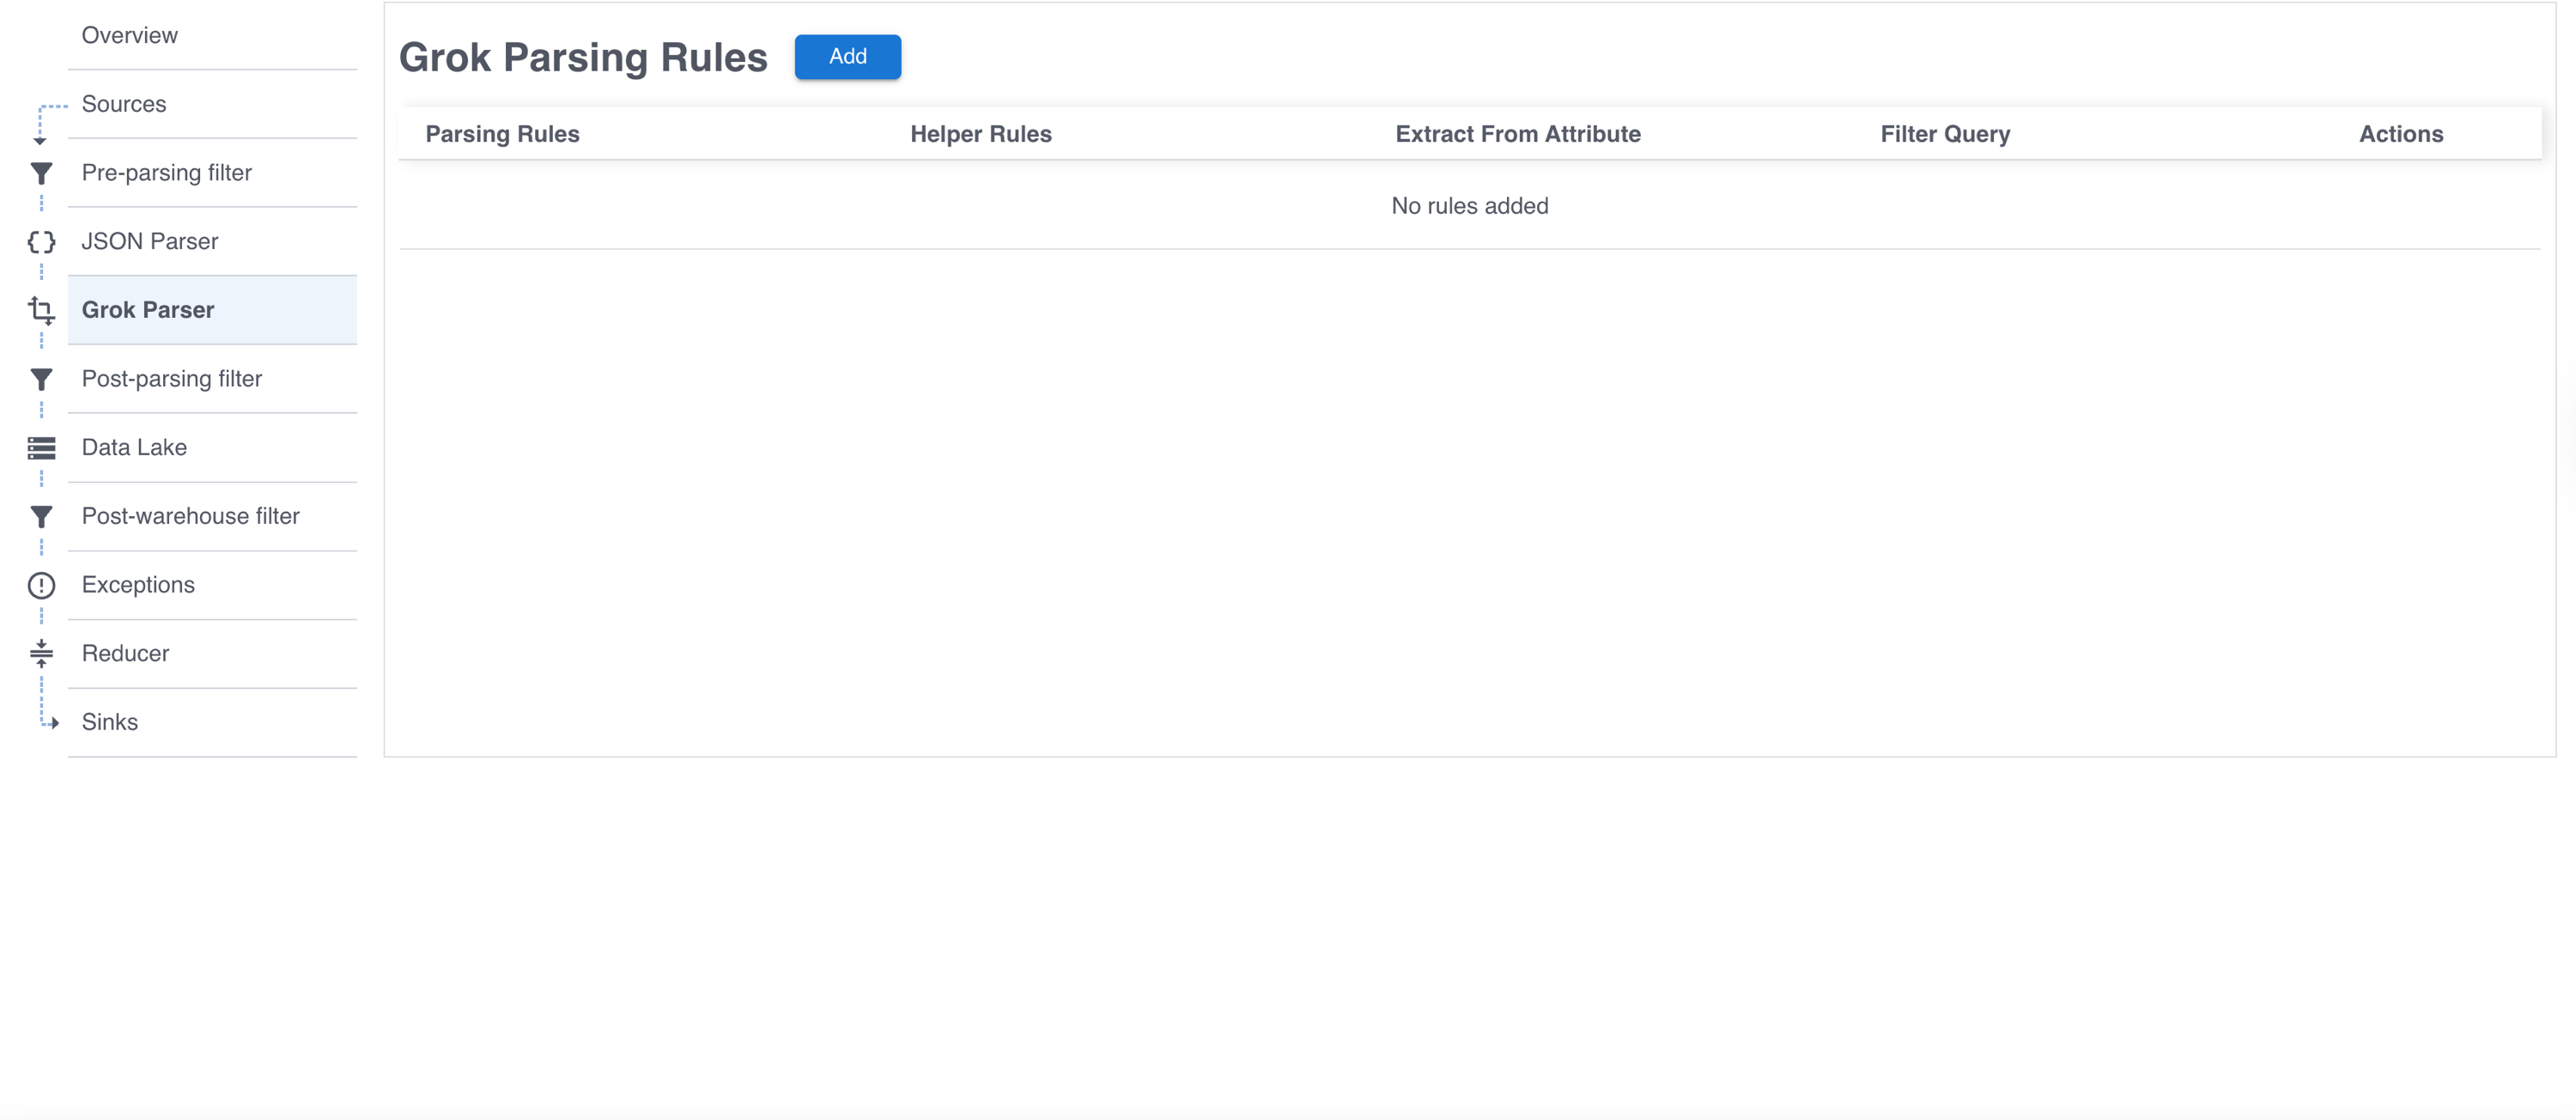
Grokking With Grepr
Grok lets teams fill the gaps when automatic field detection misses something, giving Grepr a simple way to extract key details from unstructured logs and keep data accurate.

Product Features
Understanding Pipeline Exceptions in Grepr
Grepr pipeline exceptions let engineers surface full raw logs on demand during incidents while keeping everyday log reduction in place.
Product Features
APM Signature Sampling: Enabling High-Fidelity Observability
Grepr’s Signature Sampling brings high-fidelity observability to modern systems by capturing every unique execution path without the noise or cost of traditional APM.

Events
Webinar Recap: How Fossa Saved 90% On Datadog Observability Costs with Grepr
FOSSA cut Datadog observability costs by over 90% with Grepr, reducing log volume instantly while keeping full visibility, no workflow changes, and zero data loss.

Engineering Guides
What Is an Observability Pipeline (and Why It Matters More Than Ever)
Modern observability generates too much telemetry data and too little insight, and Grepr solves this by providing an intelligent observability platform that automates data processing, routing, and storage to cut costs by over 90% while preserving full visibility.
Engineering Guides
How DORA Redefines Logging and Observability
Grepr enables financial institutions to stay compliant with DORA by maintaining full log visibility and audit readiness at a fraction of traditional costs.

Case Studies
How Jitsu Cut Logging Costs by 90% While Managing Millions of Shipments Generating 400 Logs Each
Jitsu used Grepr to cut Datadog log volume and costs by over 90 percent while keeping complete visibility, fast troubleshooting, and 13-month log retention.

Product Features
Utilize Cloudflare Logs For Cost Optimization
Grepr integrates with Cloudflare to reduce log volume and costs while retaining complete visibility into traffic, performance, and security insights.

Product Features
Monitoring Kubernetes Audit Logs
Grepr helps teams gain clear visibility into Kubernetes audit logs by filtering noise, detecting anomalies, and keeping observability costs low.

Product Features
Use Grepr With Splunk
Grepr connects seamlessly with Splunk, using machine learning to cut log volume and costs by 90 percent while preserving full data access and visibility.

Product Features
Structured Logging - What It Is and Why You Need It
Structured logging turns unstructured text logs into clear, queryable data that improves visibility, collaboration, and operational efficiency.

Product Features
Control Observability Costs Without Dropping Data
Grepr uses AI and semantic analysis to reduce observability data by 90% while retaining complete visibility for faster, more cost-efficient incident response.

Announcements
Announcing Live Edit
Grepr’s Live Edit lets you test and validate pipeline changes safely in a temporary clone, so you can fine-tune processing without affecting live data.

Product Features
Automatic Backfill
Grepr automates backfill with webhooks and rule-based triggers, restoring full log data on demand for faster, more efficient incident investigation.

Product Features
Why We Call Grepr A “Data Engine”
Grepr’s Intelligent Observability Engine uses pipelines, clustering, and adaptive sampling to process and reduce log data by up to 90% while preserving full visibility.
Case Studies
Case Study: How FOSSA Reduced Their Logs by 95% Without Burdening Their Engineers
FOSSA cut Datadog logging costs by 95% with Grepr, keeping full visibility and dashboards intact while scaling their software supply chain platform.

Product Features
Stuck Between A Rock And A Hard Place
Grepr reduces observability costs by up to 98% through intelligent data summarisation while preserving complete access to all logs when needed.
Product Features
Grepr: The 90% Log Reduction That Preserves 100% Insight
Grepr uses machine learning to cut log volume by 90% while keeping every log searchable and recoverable, giving teams lower costs and full control.

Product Features
What if You Had an AI-powered Observability Data Engine?
Grepr is building the foundation for AI-powered monitoring that understands context, reduces noise, and helps engineers catch issues before they escalate.

Announcements
Announcing the SQL Operator
Grepr SQL Operators let you reshape live log data into real time insights using simple SQL, giving you full control over metrics, traces, and alerts.
Product Features
Using Grepr With Datadog
Grepr connects directly with Datadog to reduce log volume and costs by up to 90 percent while keeping every log accessible for analysis and compliance.
.avif)
Product Features
Use Grepr to Avoid Observability Vendor Lock-In
Grepr decouples data collection from observability platforms, cutting costs and eliminating vendor lock-in while retaining complete visibility and control.

Product Features
Aggregate my log volume by 90%, yet still find anything I need? How is that possible?
Grepr uses unsupervised machine learning to reduce log volume by over 90% while preserving important data through smart, configurable aggregation. It passes low-frequency messages through unmodified, allows engineers to retain specific parameters like user IDs, and supports backfilling logs via API triggers when deeper detail is needed—such as during support tickets. For added flexibility, trace sampling can capture full logs for a subset of users, and all original logs are archived in a searchable data lake. This gives teams control, reduces noise, and enables cost-effective observability without sacrificing access to critical information.

Product Features
All Observability Data Is Equal But Some Is More Equal Than Others
Grepr helps teams keep full visibility while reducing observability data volume and costs through intelligent summarization and instant backfill.
.avif)
Comparisons
Vector vs Grepr: Comparing Observability Data Pipelines
Vector and Grepr both route observability data between sources and sinks, but they take fundamentally different approaches. Vector offers extensive manual configuration options, while Grepr uses machine learning to automatically optimize your data pipeline and cut costs by 90%.
Product Features
100% Insight With 10% Of Your Data
Grepr reduces Datadog browser logging costs by 90% by receiving all frontend logs, storing them cost-effectively, and using AI to filter repetitive data while maintaining full query access to original logs through a Datadog-compatible dashboard.
Product Features
New Relic + Grepr: A Simple Setup to Slash Observability Costs
This tutorial demonstrates reducing log volume by 90% by adding Grepr between Fluent Bit and New Relic to filter noise while retaining raw data in low-cost storage for on-demand backfilling.
Case Studies
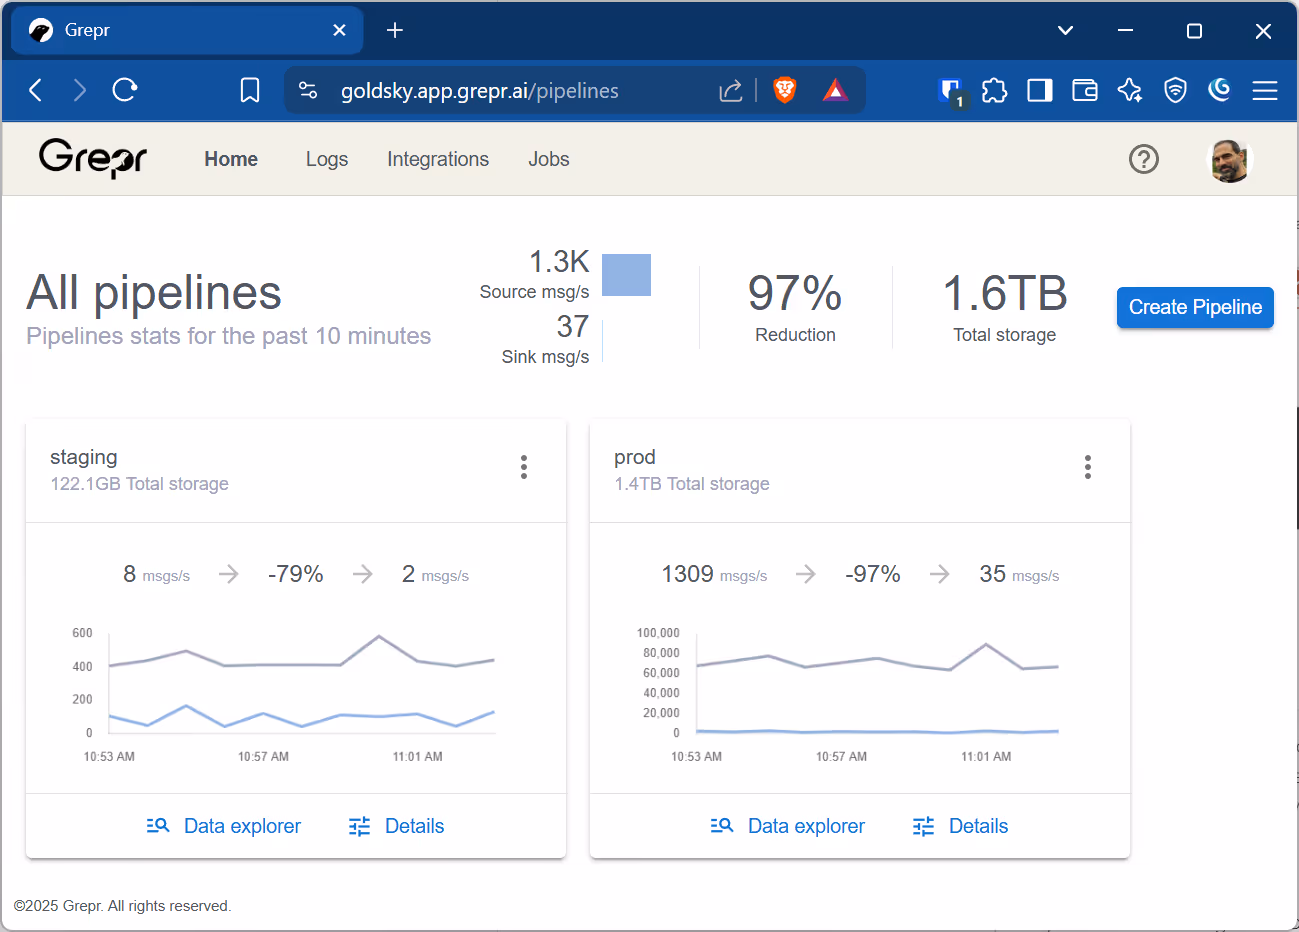
Goldsky: 96% Reduction in Datadog Logging Costs
Goldsky's logging costs had outpaced their value. After a four-week rollout, Grepr reduced their indexed logs from 5.7 billion to 250 million messages, cutting Datadog spend by 96% while keeping their observability workflows intact.
Comparisons
Grepr VS. Cribl for Automated Observability Data Filtering
Grepr uses AI to automate observability data filtering with 90% less manual configuration than Cribl's powerful but complex platform that requires dedicated teams and custom query language expertise.

Product Features
Backfill Brilliance: Cut Observability Storage Costs While Boosting Clarity with Grepr
Grepr uses machine learning to filter observability noise at ingest, storing all raw data in low-cost storage while forwarding only meaningful signals to your existing tools like Datadog, Splunk, and New Relic.

Product Features
So… what exactly does Grepr do?
Grepr is an intelligent observability engine that uses machine learning and a rules engine to detect patterns, suppress noise, and forward only essential data to your existing platforms, cutting costs by up to 90% with a single configuration change.
.gif)
Product Features
Avoiding impacts to existing alerts and dashboards with Grepr
Grepr automatically parses your existing Datadog alerts and routes the logs that power them through unchanged, letting you cut observability costs in production without rewriting a single alert.

Product Features
How to Deploy Grepr with Splunk: Reduce Log Costs by 90%
Grepr receives logs from Splunk Heavy Forwarders via S2S, compresses data by 90% while retaining everything in a queryable data lake with SPL support and one-click backfill to Splunk when needed.

Product Features
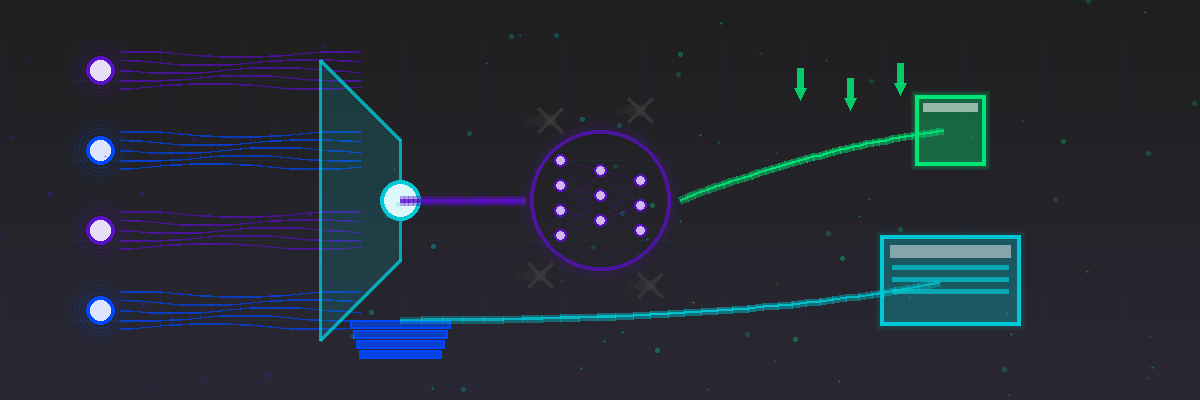
How Grepr Cuts Log Volume by 90% Using a Semantic Pipeline
Grepr's semantic pipeline automatically masks variable data, clusters similar messages, and samples or summarizes noisy patterns in real time, reducing log volume by 90% or more without dropping a single message.

Product Features
Dynamic Backfill Is Log Time Travel at 90% Lower Cost
Grepr retains all your logs in low-cost storage and backfills exactly what you need into your existing tools the moment an incident hits, so you never lose the data that explains what went wrong.

Product Features
How Grepr Delivers Complete Trace Logs Without Blowing Up Your Storage
Grepr uses distributed stream partitioning and a forgetful Bloom filter to guarantee complete log sets for sampled traces, without exhausting memory or disrupting your existing workflows.
Product Features
Using Grepr To Reduce Logging Costs
Discover how Grepr's intelligent log management solution can reduce your logging costs by 90% without sacrificing visibility. Our two-tier storage system uses machine learning to identify patterns and store less critical logs in low-cost storage, while maintaining immediate access to important data. When incidents occur, Grepr's dynamic backfill feature automatically retrieves relevant logs to your existing tools. Implement smarter logging today without changing your workflows or compromising on troubleshooting capabilities.

Product Features
Dirt-Cheap, Infinite, Queryable Log Storage: The Log Data Lake Approach
Storing logs long-term doesn't have to be super expensive. Using a data lake can reduce storage costs by more than 90% while still keeping the logs queryable and immediately accessible.

Product Features
3 Advanced Techniques to Reduce Log Volume by 90% (Part Two)
Three advanced techniques for reducing log volumes by 90% or more, including automatic pattern sampling, logarithmic sampling, and sampling with automatic backfilling, each designed to scale for enterprise environments without sacrificing critical troubleshooting data.

Product Features
Monitored Objects: How Grepr reduces Datadog metrics and host costs
Grepr's Monitored Objects approach groups metrics by entity, aggregates normal behavior, and only sends detailed data to Datadog when anomalies occur, dramatically reducing billable custom metrics and hosts without sacrificing troubleshooting capability.

Product Features
6 ways Grepr Optimizes the Logs Data Lake
Observability demands low-latency queries and flexible schemas that most open-source data lake tools can't deliver. Here are six ways Grepr closes that gap.

Product Features
4 Basic Techniques to Reduce Log Volume and Cut Observability Costs (Part One)
Four foundational techniques for reducing log volumes, including severity thresholds, log-to-metrics conversion, uniform sampling, and drop rules, along with the tradeoffs engineering teams should weigh before implementing each one.

Announcements
Why We Built Grepr: Observability Without the Waste
No engineer has ever been excited about configuring tools to drop metrics and logs just to stay within budget. But that's exactly what observability has become for most teams: an expensive, frustrating compromise between cost and visibility. Grepr was built to end that tradeoff.

Get started free and see Grepr in action in 30 minutes.
